
If you’re exploring franchise ownership, one of the first questions is “Which industries make sense for me?”
Quickly, that question splinters into more practical concerns: capital requirements, unit scalability, and whether certain sectors are even accessible to new players.
In short: Where can I afford to play, and still win?
To help answer these questions, we’ve analyzed franchise investment data across 17 industries, drawing on Franzy’s proprietary database, which tracks thousands of U.S. franchise brands.
Industry matters for market demand, personal interest, and future scaling. Some categories demand high fixed costs and complex infrastructure, but others offer lower investment thresholds and more accessible pathways to multi-unit growth.
We’ll break down average capital requirements, highlight investment outliers, and chart how each industry’s structure may affect your ability to expand.
How Much Does It Cost to Get In?
For many would-be franchisees, the biggest question isn’t “Which franchise do I want?” but “Which franchise can I afford?”
When it comes to startup costs, not all franchises are created equal. Some industries are loaded with high-capital brands that demand seven-figure commitments, while others offer more affordable, scalable options with significantly lower financial hurdles.
While every brand will dictate their own minimum and maximum investment thresholds, the average investment size varies wildly by industry. So, we looked at the average minimum investment, average maximum investment, and the range between them to get a sense of how steep—or approachable—the financial climb is.
Here’s what we found:
We identified three major industry categories, based on those investment thresholds.
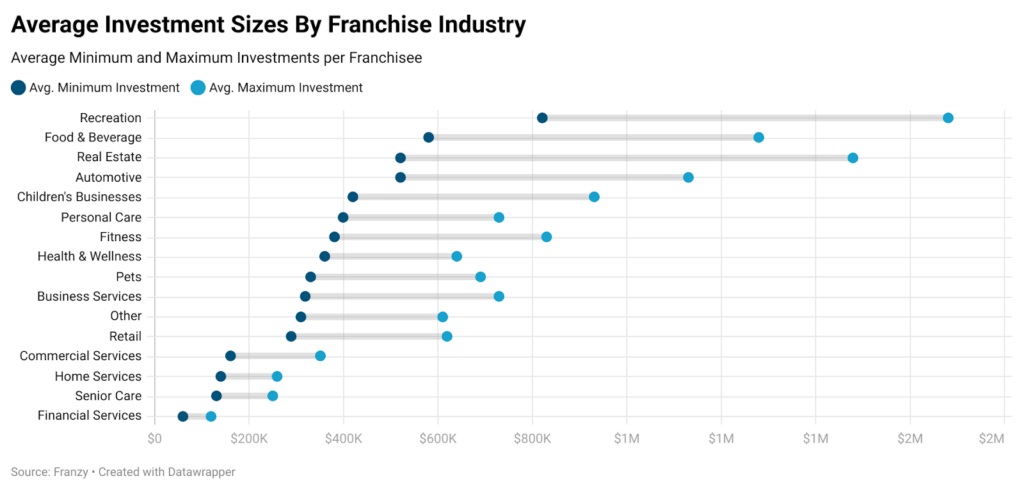
The High-Capital Ceiling: Lodging, Recreation, and Food & Beverage
At the top of the investment ladder is Lodging, with an investment size so high that we’ve left it off the chart for the sake of scale. With an average minimum investment of nearly $3 million, and an average max investment north of $10.5 million, this category is clearly geared toward institutional capital or large investment groups.
Lodging is not the only heavyweight industry: Recreation and Food & Beverage are likewise high-capital sectors with investment floor high above other industries.
Recreation franchises—spanning everything from trampoline parks to family entertainment centers—have an average minimum investment of $820,000, with upper ranges exceeding $1.6 million. The industry splits between high-capital ventures and leaner operations. Fitness and Entertainment Centers top the scale at $3.1 million, with most other Recreation franchises ranging from $500,000 to $1 million. The industry-wide average is deflated somewhat by low outliers: DIY Workshops and Youth Sports stand out with investments between $100,000 and $250,000.
Food & Beverage, is likewise capital-intensive, as expected, averaging $584,000 to start and peaking around $1.3 million. This industry doesn’t just require deep pockets— it also shows wide investment variability, indicating a fragmented landscape with both boutique and enterprise-scale brands coexisting.
To get a better look at this industry, we compared the average minimum and average maximum investments across Food & Beverage subsectors that have more than ten active brands.
Here’s what we found:
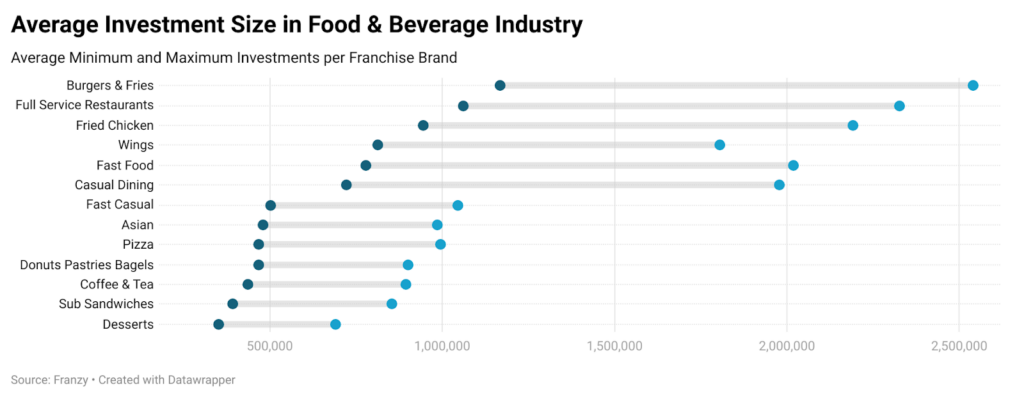
As you can see, legacy fast food brands—classics like Burger King, Wendy’s, McDonald’s, and others—bring the average investment sizes for their sectors up over $1 million. Similar trends happen for Full Service Restaurants, Fried Chicken, and general Fast Food.
Once we get into subsectors with fewer dominant, national players, the average investment lowers.
The Middle Tier: Broad Options
The bulk of franchise industries fall into a midrange zone, with average minimum investments between $300K and $750K. This includes Real Estate, Automotive, Children’s Businesses, Personal Care, Fitness, Health & Wellness, Pets, and Business Services.
In these sectors, barriers to entry are still significant but more manageable, particularly for well-capitalized individuals. For instance:
- Fitness averages a $381K minimum investment, with highs approaching $830K—a range reflective of both small studios and large gym models.
- Health & Wellness and Pets offer somewhat tighter ranges, suggesting more consistency across brand offerings.
This group represents a broad swath of franchising: highly diverse, less saturated than F&B, and often tailored to franchisees looking to scale without overreaching financially.
Low-Cost, High-Scale Sectors
At the other end of the spectrum lie four industries with average minimum investments under $200K:
- Commercial Services – $160-345,000
- Home Services – $138-255,000
- Senior Care – $128-247,000
- Financial Services – $60-118,000
The lower overhead in these industries comes from their structural differences. Most don’t require real estate or large inventories. Instead, they often depend on service models, licensing, and mobile or home-based operations.
They’re often designed for fast ramp-up and lean scaling—especially attractive to first-time franchisees or multi-unit operators looking to minimize risk while building breadth.
These lower investment thresholds also correlate with faster scaling potential. If you’re able to launch for under $150,000 and generate stable returns, replicating that model multiple times across a region becomes much more feasible. It’s no surprise that many of the most successful multi-unit operators begin in these categories.
Interpreting the Investment Landscape
Regardless of other plans, resources, and preferences, capital defines your options. High-investment categories may promise stronger brand equity or more reliable returns—but only for those who can clear the financial bar. Meanwhile, leaner models offer lower entry thresholds, which can be key to faster replication and long-term growth.
But investment size also correlates with brand strategy. Some categories are crowded with boutique or niche operators, while others favor big platforms with national ambitions.
Naturally, brands can vary significantly even within a single sector. Even in Lodging, a modular, extended-stay model might come in at half the price of a full-service hotel. Likewise, some home service brands with proprietary tech or fleet requirements may creep toward mid-tier capital needs.
Which Franchise Industries Offer the Best Multi-Unit Potential?
For someone entering franchising to build a scalable business, the ability to operate multiple units under a single brand may prove more important than the sheer size of one-time investments.
Which industries, then, better support multi-unit operations?
One way to find out is to look at industry density. Specifically, we can examine two metrics:
- The number of brands operating in each sector
- The average number of units per brand.
This combination gives us a directional sense of how fragmented or consolidated each industry is—and whether success tends to concentrate within a few large networks or spread across many smaller ones.

Brand Count vs. Average Units Per Brand, by Industry
The chart above plots each major franchise industry by the number of active brands, and the average number of units per brand.
A few outliers are missing here: Food & Beverage franchises have by far the highest number of brands—over 380—yet its units-per-brand ratio is merely average, at 185. This indicates a saturated and fragmented space, with wide variance between high-unit brands and those with minimal reach. Home Service Franchises are a similar story. With over 200 brands and relatively low unit counts per brand, it’s clear this space is crowded with specialized players: plumbers, HVACs, handymen, landscapers—each operating in their own niche.
These two industries offer broad consumer demand, but franchisees may face tougher barriers to scaling unless they’re aligning with one of the top national brands. Commercial Services and Business Services tell a very different story. Despite having a modest number of brands (55 and 57, respectively), both have remarkably high units-per-brand ratios—over 600 in Commercial and nearly 400 in Business. That kind of concentration suggests franchise models in these industries lend themselves naturally to multi-unit growth.

A closer look at the sub-sectors within Commercial and Business Service Franchises reveals why these industries punch above their weight. Staffing and Shipping & Packing are significant outliers—so extreme, in fact, they’ve been excluded from the accompanying scatter chart to preserve readability. Staffing has a whopping 387 brands in play, though its average units per brand is unexceptional, at 175. Meanwhile, shipping has only 55 brands, but an astronomical 791 average units per brand.
Other high-performing sub-sectors include Printing & Graphics and Tech & IT Services. These figures suggest that while brand count is modest, the underlying models in these verticals are optimized for scale, often built around multi-location replication or recurring enterprise demand.
Fitness, Retail, and Children’s Businesses form another cluster: all have high brand counts within our data, but relatively low unit-per-brand figures. This suggests high fragmentation, lower barriers to entry, and potentially less scalability.
The rest of the industries sit in a kind of middle ground. Lodging, Automotive, and Recreation all show relatively few brands but high average unit counts, suggesting mature industries where scaling is baked into the model—if you can get in. Lodging, in particular, has only a handful of brands but an impressive 275 units per brand on average, a sign of how dominant each flag is within its territory, not to mention the significantly higher investment costs, as discussed above.
None of this replaces due diligence on an individual brand. But at the macro level, it’s clear that some industries naturally favor multi-unit ownership. And while raw brand count tells you something about competition and demand, it’s the ratio of units to brands that reveals how scalable a franchise path might actually be.
Tracking Franchise Growth and Industry Saturation
To analyze how franchise industries are growing, saturating, or slowing down, we used data from the U.S. Small Business Administration’s franchise directory. This dataset captures thousands of SBA-registered franchise brands over the last decade, tracking the number of new franchises founded each year by industry, along with cumulative totals through 2025.
While not every franchise registers with the SBA, the directory reflects a large portion of small to mid-market brands—especially those relying on SBA-backed loans. It’s a strong proxy for main street franchising.
What follows is a breakdown of founding trends, industry stability, and saturation levels across the sectors that make up the backbone of the franchising economy.
Real Estate stands out with the highest number of SBA-recognized franchise brands—1,393 as of 2025—and shows continued growth. Unlike many sectors that have slowed, Real Estate added more brands in the latter half of the last decade, suggesting ongoing expansion.
Food & Beverage, by contrast, shows the steepest slowdown. While still large (1,247 brands), new franchise formations dropped from 434 in 2017 to just 18 in 2025. We interpret this slowdown as a sign of rising capital costs and continued uncertainty in the post-Covid economy.
Business Services (681 brands) and Automotive (558) also saw major drops in annual brand formation over the last eight years—157 and 98 fewer, respectively—suggesting consolidation or reduced need for new brand variants due to tech efficiencies. Yet both remain fertile categories in absolute terms, with large footprints and strong infrastructure.
Some smaller sectors have seen flat or minimal growth.
Recreation saw just 35 new brands over nine years, with high investment requirements likely acting as a barrier.
Pets, Senior Care, and Children’s Businesses also show low saturation and less competition, but their cumulative totals (ranging from 78 to 135) suggest low saturation and room for growth in specialized consumer services.
One important caveat: this data only reflects franchises registered with the SBA—hardly a full picture of the market. Brands that are self-funded, private-equity backed, or operating with capital-light models may never appear here. Some high-growth or prestige franchises are essentially invisible in this sample.
Still, the data serves as a strong proxy for the “main street” segment of franchising, where SBA lending access matters. With 1 in 5 SBA loans going to franchisees, these SBA figures represent a cross-section of American entrepreneurs.
It offers a window into where traditional, finance-accessible franchise activity is growing or stagnating. Real Estate and Home Services show resilience. Business Services and Automotive appear stable but consolidating. Food & Beverage, though still dominant, hasn’t rebounded to pre-pandemic growth levels.
From Data to Decision
Franchising isn’t one-size-fits-all. The industry you choose will determine not only your upfront investment and your chances of replicating success across multiple units, but also by your own personal preferences for running your business.
Our data shows that while sectors like Food & Beverage and Recreation demand deep pockets, they may not always offer scale. Meanwhile, categories like Commercial and Business Services present leaner entry points with built-in potential for multi-unit growth.
Whether you’re an experienced operator or a first-time buyer, aligning your capital, capabilities, and growth ambitions with the right industry makes all the difference. And while this data paints a macro-level picture, it’s only the starting point.
The next step is due diligence—on the brand, the territory, and your own strategic fit.